Real Estate Market Updates: June 2025
We’ve reached the midpoint of 2025, and according to most economists the national real estate market is beginning to show signs of balancing. Locally, individual markets are still thriving while a few have slowed, but overall predictions are still largely impacted by the national picture. With interest rates holding steady and the unpredictability of the effects of tariffs, many believe potential volatility is still impacting buyers across the board.
According to NAR Chief Economist Lawrence Yun, existing homes sales went up .8% from April to May 2025 while the year-over sales decreased by .7%.
“The relatively subdued sales are largely due to persistently high mortgage rates,” he said. “Lower interest rates will attract more buyers and sellers to the housing market. Increasing participation in the housing market will increase the mobility of the workforce and drive economic growth.”
The national median home sale price is $422,800, which represents a 1.3% change year-over-year for the month of May. This has decreased every month since December 2024, when the median sale prices were increasing by 5.8%.
According to Forbes Advisor, a buyer purchasing a house at this price, putting 20% down with an interest rate at 6.8% for a 30-year mortgage will pay $2,200 a month. This does not include home insurance, property taxes, and HOA payments, if necessary, which could bring the total closer to $2,800. NAR’s annual report indicates just over 74% of buyers in 2024 financed their home and 50% of homebuyers used a conventional loan. 38% of buyers in 2024 used an FHA or VA loan, so monthly payments could easily exceed $3,000 a month at the above price point for most buyers.
First time home buyers represented 30% of the market in May, down from 31% in May 2024. 17% of sale purchases in May came from investors, up 1% from the same time last year. 27% of all sales were cash transactions, also down 1%, and year-to-year distressed sales rose from 2% to 3% of all transactions. Homes spent an average of 27 days on the market in May, up from 24 days in 2024, representing the gradual shift toward a buyer’s market as supply increases. Many leaders also dispel the rumors by some in the profession that indicate a 2008-type of change and say there are too many economic factors that will prevent a surge of buyers entering the market, overwhelming demand.
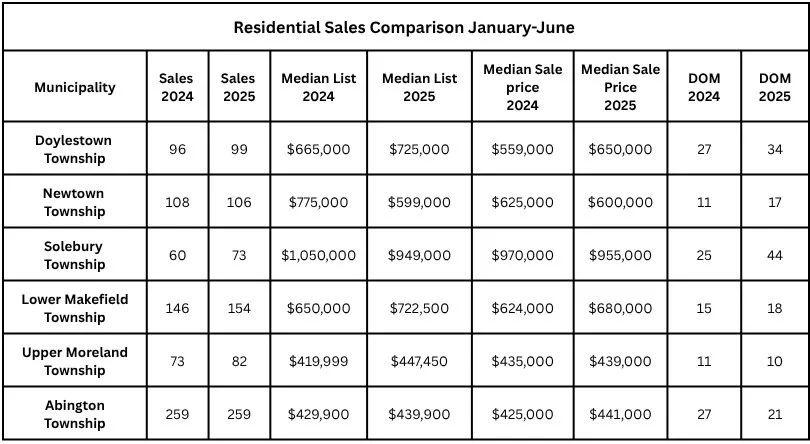
Source: Bright MLS
Since the Philadelphia area continues to grow, many local markets have seen changes along the national and state trends while others continue to perform well above, creating unique opportunities for buyers, sellers, and investors.
In Bucks County, Doylestown (3.1%, 16.3%) and Lower Makefield (5.5%, 9%) continue to see a steady increase in sales and median sale prices. Newtown (-4%) and Solebury (-1.6%) had slight decreases in median sale prices and a much higher time on the market with homes staying 55% and 76% longer respectively before transacting. Solebury also had a 21.7% increase in sales from the first half of 2025 compared to the first half of 2024. As a whole, the highlighted markets in Bucks spent more time on the market.
In Montgomery County, Abington had a 3.8% increase in median sale prices and a 22% decrease in time on the market, indicating a positive opportunity for sellers. Upper Moreland had a 12.3% increase in sales, a less than 1% drop in median sale prices, and a 9% drop in days on the market. With an average of 10 days on the market, Upper Moreland represents the fastest-moving of the highlighted markets for the first half of the year.
Compared to national averages, in the highlighted markets, home sales are higher, median sales prices are higher, and the days on market are higher (though some markets trend differently in specific measures), indicating continued growth but a shift toward balance. In Bucks County in particular, the ratio of pending sales to active listings is 1.16, which is well below the 5-year average. This shows there is more inventory county-wide than in previous years.
-
April 2026
- Apr 1, 2026 Book of the Month: The Untethered Soul by Michael A. Singer Apr 1, 2026
-
February 2026
- Feb 21, 2026 Book of the Month: The 4 Disciplines of Execution by Chris McChesney, Sean Covey, and Jim Huling Feb 21, 2026
- Feb 9, 2026 How the Seller Disclosure Law of PA Affects Buyers and Sellers Feb 9, 2026
-
January 2026
- Jan 19, 2026 What To Expect In Real Estate Trends For 2026 Jan 19, 2026
- Jan 11, 2026 Book of the Month: Deep Work by Cal Newport Jan 11, 2026
- Jan 4, 2026 Your One Action for 2026 Jan 4, 2026
-
December 2025
- Dec 31, 2025 Top Stories of the Year Dec 31, 2025
- Dec 19, 2025 Book of the Month: Mastery by Robert Greene Dec 19, 2025
- Dec 15, 2025 Removing Popcorn Ceilings For a Cleaner Finish Dec 15, 2025
- Dec 7, 2025 Late Fall Real Estate Market Updates Dec 7, 2025
-
November 2025
- Nov 23, 2025 Book of the Month: Peak: Secrets From the New Science of Expertise by Anders Ericsson and Robert Pool Nov 23, 2025
- Nov 19, 2025 8 Home Maintenance Tasks To Check Off Your List Before Winter Nov 19, 2025
-
October 2025
- Oct 23, 2025 Book of the Month: Find Your Why by Simon Sinek Oct 23, 2025
- Oct 13, 2025 How Capital Gains May Impact Real Estate Decisions Oct 13, 2025
- Oct 2, 2025 Me Meetings to Get Priority Tasks in Order Oct 2, 2025
-
September 2025
- Sep 25, 2025 5 Soccer Teambuilders Any Coach Can Use Right Now Sep 25, 2025
- Sep 17, 2025 What to Know about a Home Appraisal Contingency Sep 17, 2025
- Sep 11, 2025 Teambuilding to Start the Season on the Same Foot Sep 11, 2025
- Sep 5, 2025 Book of the Month: The 5 Types of Wealth by Sahil Bloom Sep 5, 2025
-
August 2025
- Aug 28, 2025 Rent vs Buy: By the Numbers Aug 28, 2025
- Aug 22, 2025 Leaving Everything on the Field Aug 22, 2025
- Aug 17, 2025 Books of the Month: The Creative Act: A Way of Being by Rick Rubin and The War of Art by Steven Pressfield Aug 17, 2025
- Aug 13, 2025 Rent vs Buy: How to Choose Aug 13, 2025
- Aug 6, 2025 Inspection Contingencies and Timelines Aug 6, 2025
- Aug 3, 2025 Lessons From Painting and Soccer Camp Aug 3, 2025
-
July 2025
- Jul 23, 2025 Finding the Point Jul 23, 2025
- Jul 16, 2025 Book of the Month: Think Like a Monk: Train Your Mind for Peace and Purpose Every Day by Jay Shetty Jul 16, 2025
- Jul 9, 2025 Real Estate Market Updates: June 2025 Jul 9, 2025
- Jul 2, 2025 Taking Time Out to Re-Align Jul 2, 2025
-
June 2025
- Jun 25, 2025 Navigating Home Sale Contingencies Jun 25, 2025
- Jun 17, 2025 The Crossing Fawn Jun 17, 2025
- Jun 4, 2025 Book of the Month: Notes from a Deserter by C.W. Towarnicki Jun 4, 2025
-
May 2025
- May 29, 2025 We Are What We Eat May 29, 2025
- May 22, 2025 The Ins and Outs of Mortgage Contingencies May 22, 2025
- May 8, 2025 Coaching Fundamentals: Reflect and Repeat May 8, 2025
-
April 2025
- Apr 23, 2025 How Rory McIlroy Remained Present to Win the Masters Apr 23, 2025
- Apr 2, 2025 Coaching Fundamentals: Mastering the Demonstration for Player Understanding Apr 2, 2025
-
March 2025
- Mar 12, 2025 Book of the Month: Atomic Habits by James Clear Mar 12, 2025
-
February 2025
- Feb 27, 2025 5 Answers For Potential Homebuyers Entering the Spring Market Feb 27, 2025
- Feb 6, 2025 Investing Basics with Chris Strivieri, Founder and Senior Partner of Intuitive Planning Group in Alliance with Equitable Advisors Feb 6, 2025
-
January 2025
- Jan 30, 2025 Book of the Month: The MetaShred Diet Jan 30, 2025
- Jan 20, 2025 Residential Housing Trends in 2025 Jan 20, 2025
- Jan 9, 2025 Understanding the Use and Occupancy Certificate Jan 9, 2025
-
December 2024
- Dec 4, 2024 Book of the Month: How Champions Think by Dr. Bob Rotella Dec 4, 2024
-
November 2024
- Nov 19, 2024 Professional Spotlight: Fran Weiss, Owner of Weiss Landscaping Nov 19, 2024
-
October 2024
- Oct 29, 2024 Book of the Month: Hidden Potential by Adam Grant Oct 29, 2024
- Oct 21, 2024 Professional Spotlight: James George, President, Global Mortgage Oct 21, 2024
- Oct 15, 2024 Buyers Post-NAR Settlement Oct 15, 2024