Rent vs Buy: By the Numbers
Rent vs Buy has become a hot topic as of late. With home prices still rising, interest rates remaining the same, the uncertain effects of tariffs on inflation, and the demand for homes higher than supply in most parts of the Greater Philadelphia area, many potential homebuyers are faced with the difficult decision of whether to buy or rent. A previous post highlighted the pros and cons to each, with money, time, emotional and physical wellbeing all important factors. Sometimes, it’s easier to see the numbers, so potential homebuyers can make the best decision.
(Disclaimer: Many articles and websites, including ones referenced, compare monthly rentals and sales to a period beginning around 2021, which was historically the largest spike in home sales and rentals in our lifetime due to a Covid market freeze followed by extremely low interest rates to stimulate growth. So the year-to-year numbers going back to 2021 will show dramatic declines in monthly rental payments and inclines in monthly mortgage payments, which fuels the spicy “generation of doomed homebuyers” narrative. There is a clear and obvious short-term financial advantage to renting in our area. The goal of this post is to provide information on the buy-rent gap, so anyone interested in real estate can make informed decisions.)
The sample properties compared throughout this article are 3 bedroom, 1.5 to 2.5 bath townhomes. Considered a starter home for most first-time buyers, a merging property for couples or friends, or a downsize option for empty nesters, these properties have been selected for their uniformity across a wide number of areas. The neighborhoods selected are located in Bucks and Montgomery Counties, where as detailed in another post about current local trends, home prices continue to go up in specific markets.
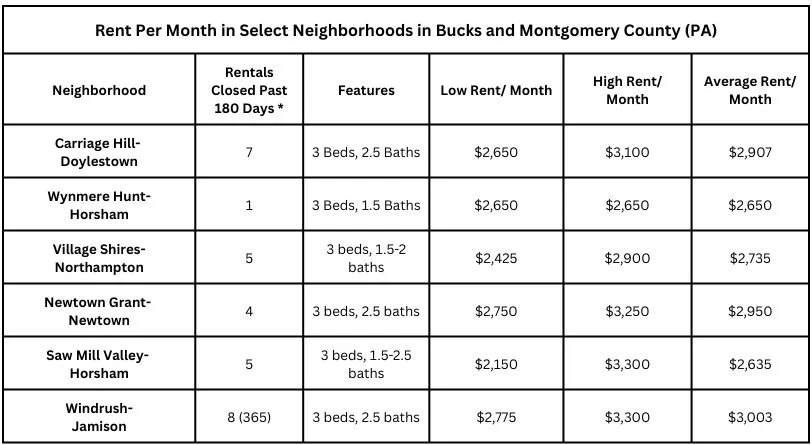
* The properties selected represent the number of homes rented with the specific comparable features (3 beds, 1-2.5 baths) within the past 180 days (unless noted). The total number of rentals closed is higher in every market.
Source: Bright MLS as of August 2025
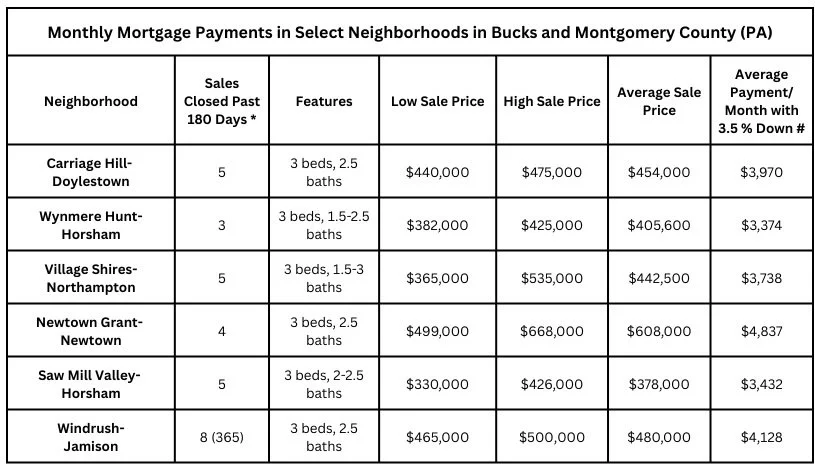
* The properties selected represent the number of homes rented with the specific comparable features (3 beds, 1-2.5 baths) within the past 180 days. The total number of homes closed is higher in every market.
# The monthly payment uses a 30-year fixed, 6.5% interest rate, 3.5% down payment, and $1,800 per year in Homeowner’s insurance. The payment also reflects annual taxes, mortgage insurance, and HOA (if applicable) for the specific neighborhood.
Source: Bright MLS. Calculations from Fannie Mae
Referencing the two tables above, it’s clear that renting is cheaper than buying in each of the highlighted neighborhoods. This is a trend found in most markets around the country and with the exception of post-economic breakdowns, is typical in the rent vs buy conversation. However, most buyers want to know the differences in how each decision impacts their finances. Of the six neighborhoods, the average difference between renting and buying is $1,099 per month. Newtown Grant has the largest gap in monthly mortgage payment vs rent at $1,887 per month, a 48.5% swing. Wynmere Hunt has the smallest difference at $724 per month, or 24%.
According to Bankrate, in February, the national average per monthly mortgage payments was $2,768 versus $2,000 a month in rent, which equals a difference of $768 or 32.2%. Carriage Hill (30.9%), Village Shires (31%), and Windrush (31.5%) all fall within 2% of the national average while Saw Milly Valley (26.2%) remains below the national average. That’s two neighborhoods in Horsham Township where the gap between buying and renting is well below the national average. These neighborhoods are still well above the $1,590 per month average for Pennsylvania properties according Zillow, which shouldn’t be surprising.
Jiayi Xu and Danielle Hale, in an article for realtor.com, posted an update on the largest metro markets across the country that shows the buy-rent gap declining for 0-2 bedroom homes from this time last year. “In June 2025, the average monthly cost of buying a starter home in the top 50 metros was $908 (53.1%) higher than renting, whereas the cost of buying was $956 (54.7%) higher than renting in June 2024.”
Pittsburgh was the only metro area out of 50 where buying a starter home was more affordable than renting, but in the Philadelphia-Camden-Wilmington metro homes averaged $1,770 a month to rent vs $2,395 a month to buy, a difference of $625, or 35.3%. The article also claims the cost to rent has gone down 2.4% while the cost to buy has gone down 2.7%. However, this is one of the reasons why researching local markets becomes necessary because throughout the Philadelphia metro area, there are neighborhoods where the buy-rent gap is higher than the state and national averages and others where the gap is lower.
One of the main financial reasons why individuals buy a home instead of renting is because ownership helps build equity, which improves an owner’s financial power over time. One of the drawbacks to obtaining a mortgage is the amount of interest paid to a lender for borrowing the money to purchase. A potential buyer needs to give to receive, and when it comes to home ownership, each individual must weigh the overall costs of ownership. The total interest paid over time to build equity is very high, in the hundreds of thousands for each of the highlighted properties. The incremental shift of more money that goes towards principal and less toward interest each month, known as amortization, is a scale of numbers we don’t often look at when viewing our loan statements, but it is very real.
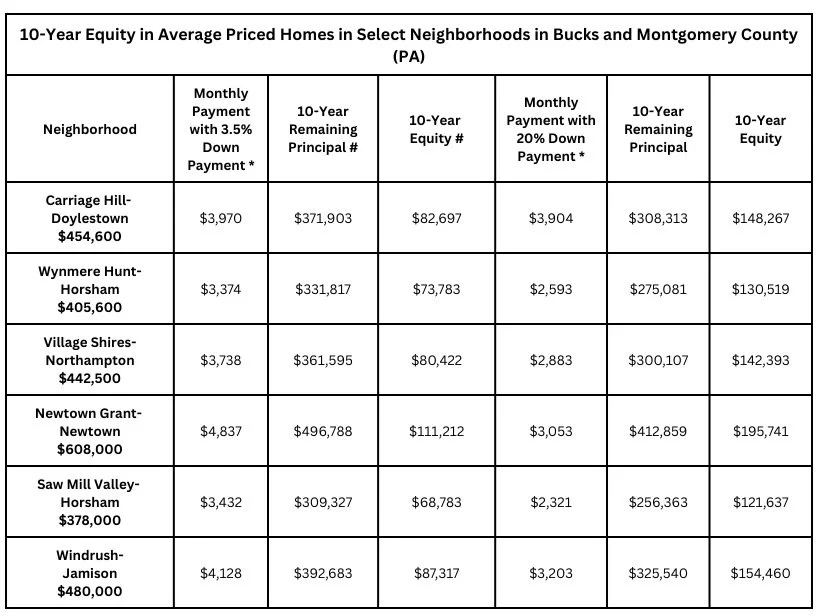
* The monthly payment uses a 30-year mortgage with a fixed 6.5% interest rate and $1,800 per year in Homeowner’s insurance. The payment also reflects annual taxes, mortgage insurance, and HOA (if applicable) for the specific neighborhood.
# Not including fluctuations in equity due to market changes and/or a reduction in mortgage insurance after reaching 80% of the property’s loan-to-value.
Source: Bright MLS August 2025 and Bankrate
Equity represents one of the biggest differences between buying vs renting over time. Using the above examples, a buyer would build an average of $84,035 in equity in the highlighted neighborhoods after 10 years with 3.5% down and $148,836 in equity for 20% down. These numbers can change depending on the type of loan (conventional, FHA, VA), term of the loan (15-year vs 30-year, fixed vs arm), percentage down, and the time it takes to reach a loan-to-value percentage, usually 80%, when private mortgage insurance is no longer necessary. The numbers also change when the value of the home rises or falls, though more likely to rise in our current economy, and equity will increase at a greater rate as the loan reaches the end of its term.
During that same 10-year period, the renter will have attained $0 in equity.
No matter the decision, buying or renting has to make sense for the potential homebuyer, who must weigh the short-term and long-term pros and cons to make either dream scenario a reality. Experienced agents are available to help make either decision happen.
Feel free to contact me if you’re considering one or the other and would like a detailed analysis of your search area.
-
April 2026
- Apr 1, 2026 Book of the Month: The Untethered Soul by Michael A. Singer Apr 1, 2026
-
February 2026
- Feb 21, 2026 Book of the Month: The 4 Disciplines of Execution by Chris McChesney, Sean Covey, and Jim Huling Feb 21, 2026
- Feb 9, 2026 How the Seller Disclosure Law of PA Affects Buyers and Sellers Feb 9, 2026
-
January 2026
- Jan 19, 2026 What To Expect In Real Estate Trends For 2026 Jan 19, 2026
- Jan 11, 2026 Book of the Month: Deep Work by Cal Newport Jan 11, 2026
- Jan 4, 2026 Your One Action for 2026 Jan 4, 2026
-
December 2025
- Dec 31, 2025 Top Stories of the Year Dec 31, 2025
- Dec 19, 2025 Book of the Month: Mastery by Robert Greene Dec 19, 2025
- Dec 15, 2025 Removing Popcorn Ceilings For a Cleaner Finish Dec 15, 2025
- Dec 7, 2025 Late Fall Real Estate Market Updates Dec 7, 2025
-
November 2025
- Nov 23, 2025 Book of the Month: Peak: Secrets From the New Science of Expertise by Anders Ericsson and Robert Pool Nov 23, 2025
- Nov 19, 2025 8 Home Maintenance Tasks To Check Off Your List Before Winter Nov 19, 2025
-
October 2025
- Oct 23, 2025 Book of the Month: Find Your Why by Simon Sinek Oct 23, 2025
- Oct 13, 2025 How Capital Gains May Impact Real Estate Decisions Oct 13, 2025
- Oct 2, 2025 Me Meetings to Get Priority Tasks in Order Oct 2, 2025
-
September 2025
- Sep 25, 2025 5 Soccer Teambuilders Any Coach Can Use Right Now Sep 25, 2025
- Sep 17, 2025 What to Know about a Home Appraisal Contingency Sep 17, 2025
- Sep 11, 2025 Teambuilding to Start the Season on the Same Foot Sep 11, 2025
- Sep 5, 2025 Book of the Month: The 5 Types of Wealth by Sahil Bloom Sep 5, 2025
-
August 2025
- Aug 28, 2025 Rent vs Buy: By the Numbers Aug 28, 2025
- Aug 22, 2025 Leaving Everything on the Field Aug 22, 2025
- Aug 17, 2025 Books of the Month: The Creative Act: A Way of Being by Rick Rubin and The War of Art by Steven Pressfield Aug 17, 2025
- Aug 13, 2025 Rent vs Buy: How to Choose Aug 13, 2025
- Aug 6, 2025 Inspection Contingencies and Timelines Aug 6, 2025
- Aug 3, 2025 Lessons From Painting and Soccer Camp Aug 3, 2025
-
July 2025
- Jul 23, 2025 Finding the Point Jul 23, 2025
- Jul 16, 2025 Book of the Month: Think Like a Monk: Train Your Mind for Peace and Purpose Every Day by Jay Shetty Jul 16, 2025
- Jul 9, 2025 Real Estate Market Updates: June 2025 Jul 9, 2025
- Jul 2, 2025 Taking Time Out to Re-Align Jul 2, 2025
-
June 2025
- Jun 25, 2025 Navigating Home Sale Contingencies Jun 25, 2025
- Jun 17, 2025 The Crossing Fawn Jun 17, 2025
- Jun 4, 2025 Book of the Month: Notes from a Deserter by C.W. Towarnicki Jun 4, 2025
-
May 2025
- May 29, 2025 We Are What We Eat May 29, 2025
- May 22, 2025 The Ins and Outs of Mortgage Contingencies May 22, 2025
- May 8, 2025 Coaching Fundamentals: Reflect and Repeat May 8, 2025
-
April 2025
- Apr 23, 2025 How Rory McIlroy Remained Present to Win the Masters Apr 23, 2025
- Apr 2, 2025 Coaching Fundamentals: Mastering the Demonstration for Player Understanding Apr 2, 2025
-
March 2025
- Mar 12, 2025 Book of the Month: Atomic Habits by James Clear Mar 12, 2025
-
February 2025
- Feb 27, 2025 5 Answers For Potential Homebuyers Entering the Spring Market Feb 27, 2025
- Feb 6, 2025 Investing Basics with Chris Strivieri, Founder and Senior Partner of Intuitive Planning Group in Alliance with Equitable Advisors Feb 6, 2025
-
January 2025
- Jan 30, 2025 Book of the Month: The MetaShred Diet Jan 30, 2025
- Jan 20, 2025 Residential Housing Trends in 2025 Jan 20, 2025
- Jan 9, 2025 Understanding the Use and Occupancy Certificate Jan 9, 2025
-
December 2024
- Dec 4, 2024 Book of the Month: How Champions Think by Dr. Bob Rotella Dec 4, 2024
-
November 2024
- Nov 19, 2024 Professional Spotlight: Fran Weiss, Owner of Weiss Landscaping Nov 19, 2024
-
October 2024
- Oct 29, 2024 Book of the Month: Hidden Potential by Adam Grant Oct 29, 2024
- Oct 21, 2024 Professional Spotlight: James George, President, Global Mortgage Oct 21, 2024
- Oct 15, 2024 Buyers Post-NAR Settlement Oct 15, 2024